Rerurn to Romy the Cat's Site
In the Forum: Audio Discussions
In the Thread: It’s mad, mad, mad... electricity.
Post Subject: Not convinced by thisPosted by Lx_ on: 4/11/2011
fiogf49gjkf0d
Romy,
Thank you for this experiment and sharing the recorded files. This makes for some very interesting analysis.
 Romy the Cat wrote: Romy the Cat wrote: |
| The visual comparing of the file also indicate that difference is VERY dramatic. The file above is from good electricity day and below is from bad day. |
|
Can you point out where and how in the picture the two files look very dramatically different? Because they look pretty much the same to me.
| Romy the Cat wrote: |
| Here is the 3D diference from 20Hz to 20.000Hz |
|
Did you do an audio file comparison on the two files posted? Unfortunately one should not do that, because the files are not synchronized/time-aligned. For example, look at this close-up starting at 1m52s:
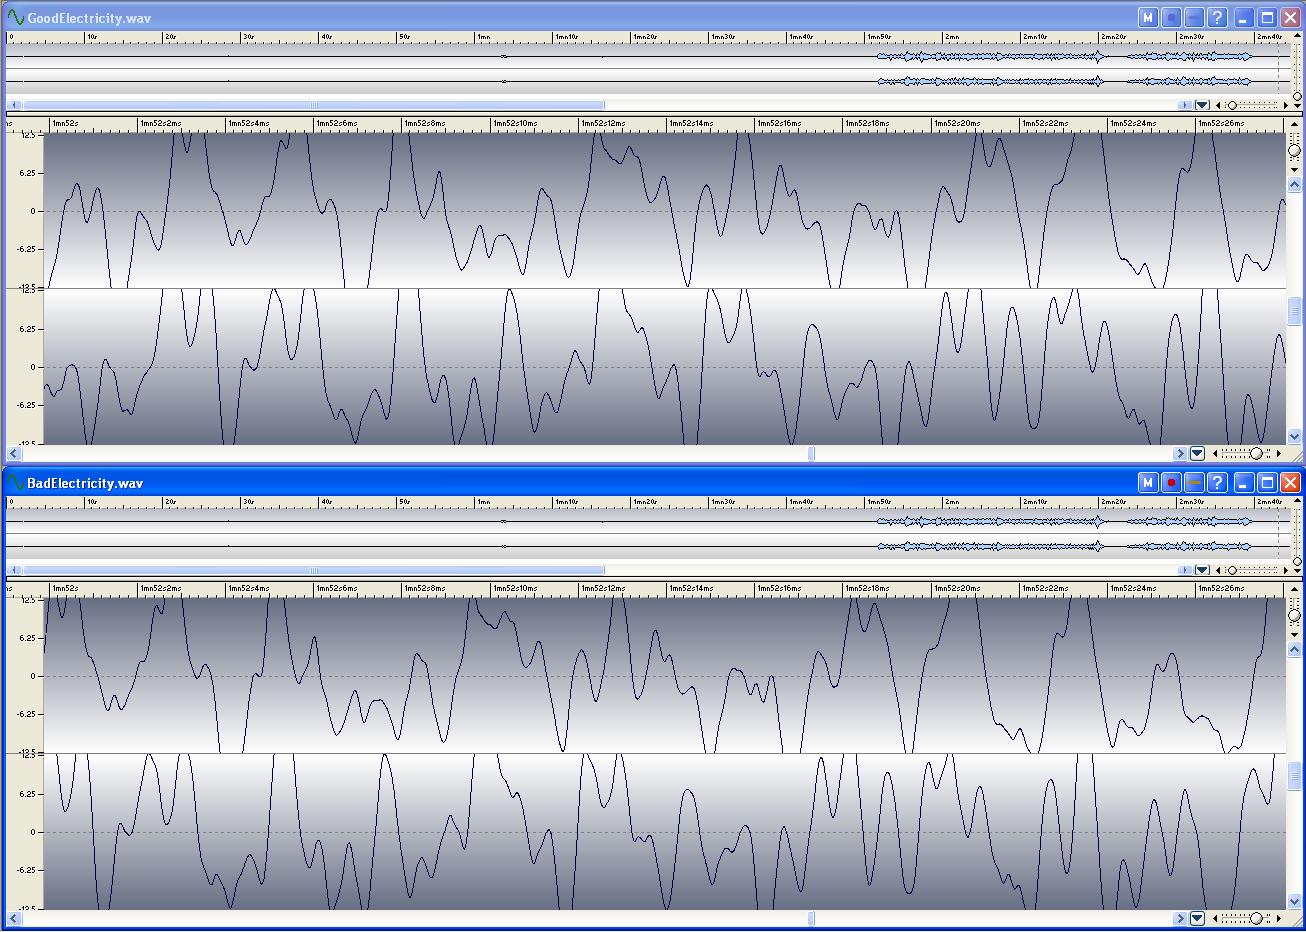
It is clear that the waveforms for good and bad are identical, but look at how the one for the good electricity (the top one) is late (shifted to the right) compared to the other, by around 2.8ms. This means that a raw diff is meaningless.
I tried to remove some samples from one file to "fix" the time offset. I was able to reduce the diff amplitude already, but it seems the offset varies with time which makes it so much more difficult to get the real diff between the two signals.
Diff for the original files:
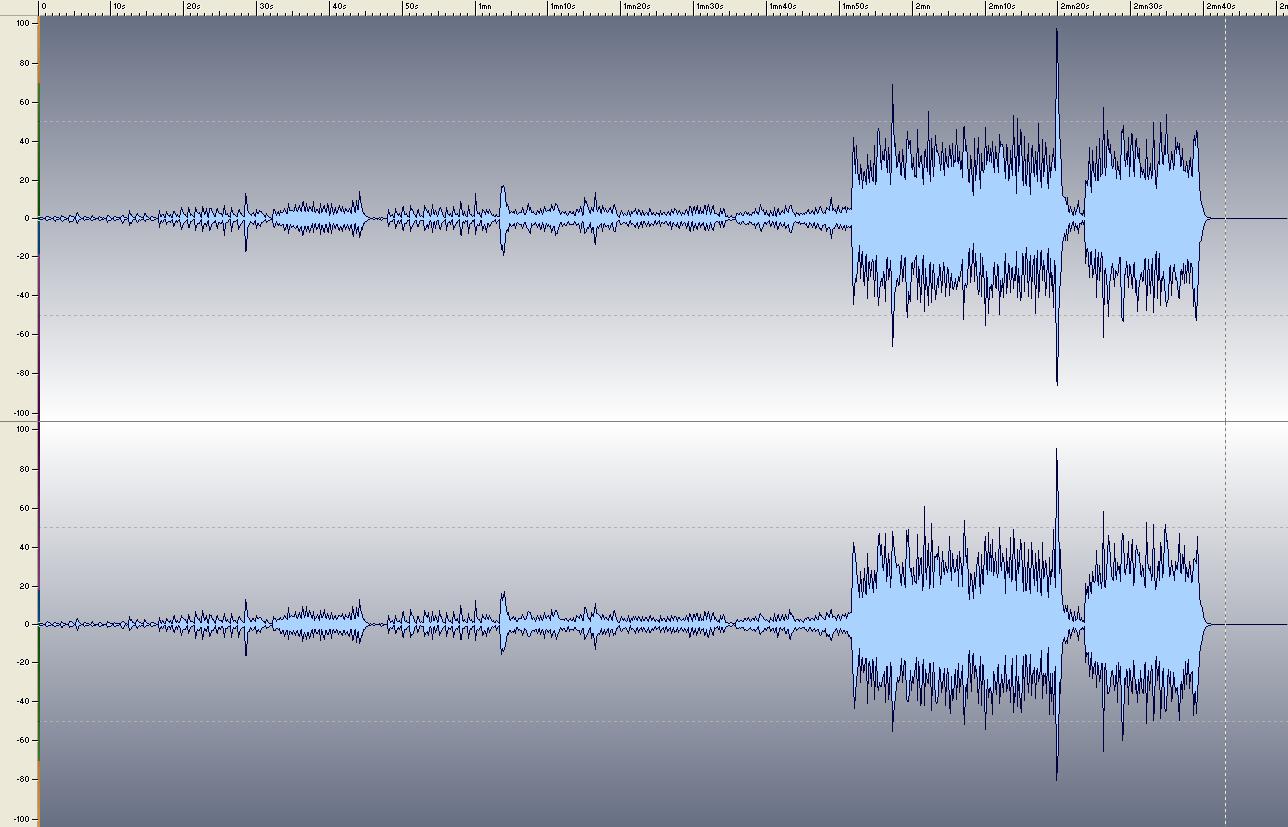
Diff for the files with reduced time offset:
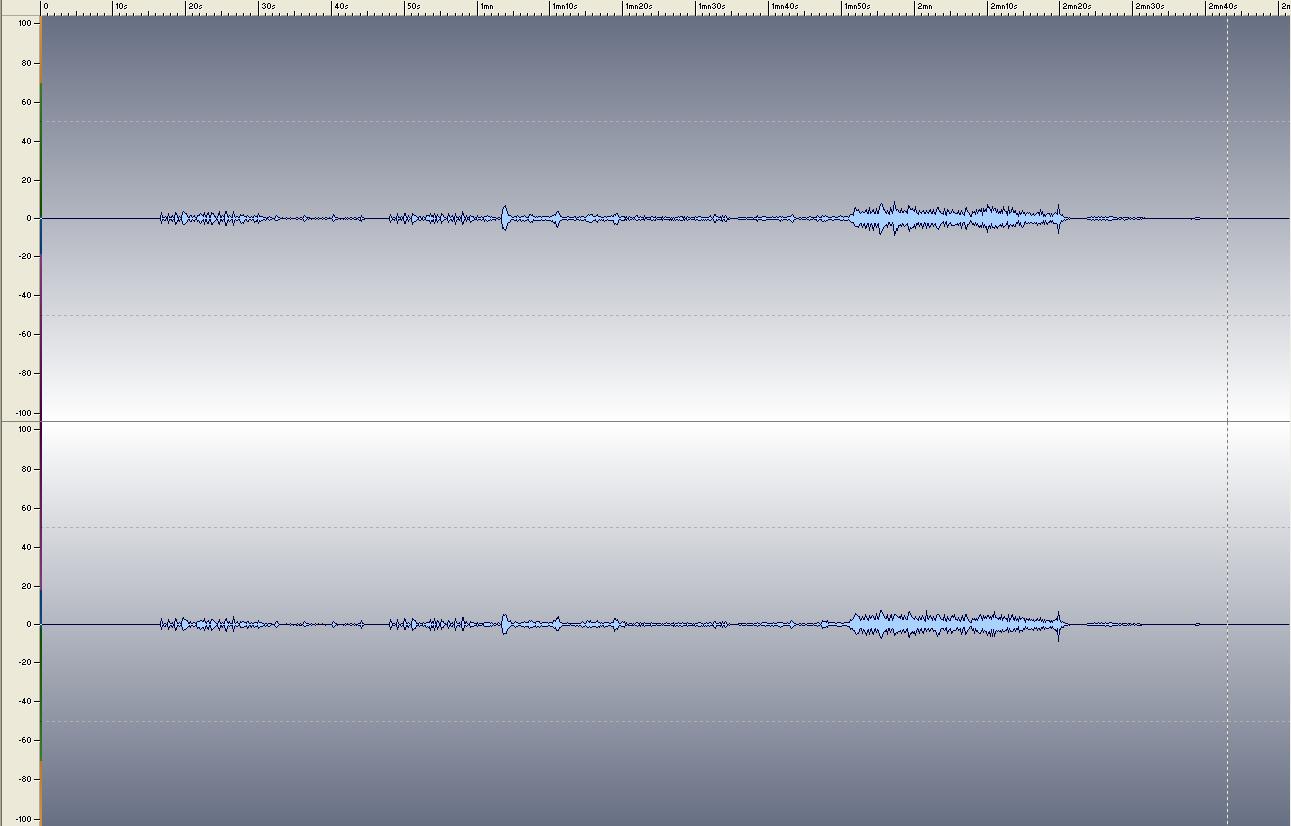
(Scale is the same)
In particular, look at how the large diff near the end (from 2m23s onwards) almost disappears.
| Romy the Cat wrote: |
| The data above proves that it is perfectly
possible to develop a sonic text that will objectively, without any BS
or excuses for deafness or ignorance to measure SONIC performance of
electricity. The test might be loaded from USB flash card and measure
how suitable given electivity for Sound. |
|
Well, maybe this can be done. I am sure that bad sound from
electricity can be measured and shown. But I do not think the pictures
posted so far do that.
I am pretty sure that normal playback variations can explain differences in the time domain that we observe. We should try to remove that variability to be able to analyze what happens in other domains (amplitude, frequency?). However, that could be very difficult (if not outright impossible) and in doing so we risk losing information about time garbage introduced by bad electricity (jitter? hopefully time variability from playback is slow, so removing it should keep electricity-induced jitter).
I'll try getting better results and will post if anything interesting comes up.
Rerurn to Romy the Cat's Site